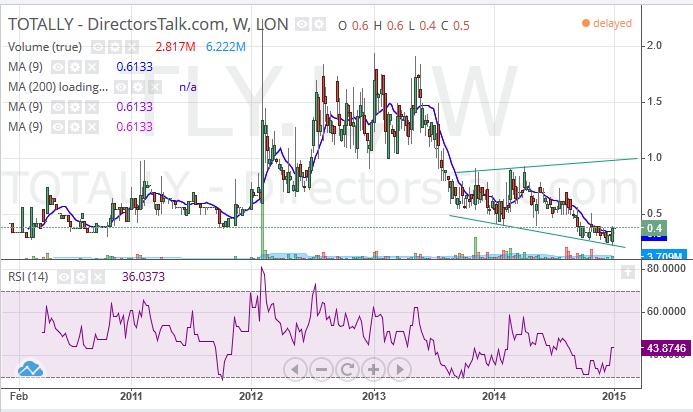
The first thing to note about the daily chart of Totally PLC (LSE:TLY) as a general observation is that we are looking at a stock which is perhaps not the most actively traded on the London market, and hence levels of support and resistance may be have to be somewhat “flexible.” However, rather than blurring the technical picture it may be said that in such situations charting techniques can prove to very helpful in terms of giving traders and investors guidance on price action, and most importantly price targets. For instance, the overall picture for Totally shares since August 2013 is that of gyrations within a broadening triangle formation which can be drawn from that time with the support line projection having been multi tested since September. It currently runs down to 0.25p .
However, it is probably the initial October 0.3p support which is the most useful support point to use as this is the end of day close stop loss on the recovery argument. This argument is backed by strong bullish divergence in the RSI window in the wake of the December bear trap recovery from below October support. The initial target now over the course of the rest of January is the 200 day moving average at 0.52p, with the longer Q1 2015 destination seen as being as high as 1p at the top of the 2013 broadening triangle. A weekly close above the 200 day line is the momentum trigger on any move to 1p.