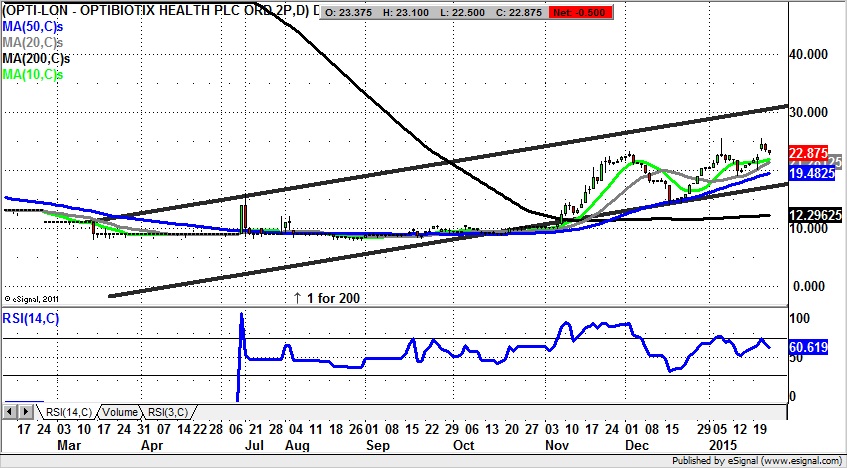
After a nightmare plunge for the stock in 2013 it can be said quite fairly that shares of Optibiotix PLC (LON: OPTI) have morphed into a charting situation which effectively renders it a classic recovery play. This is one that ticks most of the best known boxes on the technical front. They include the 50 day /200 day moving average golden cross buy signal in November which followed the as yet untested break above the 200 day line now at 12.29p at the beginning of that month. That event really was the giveaway as far as signalling to us that Optibiotix would be the big winner over the near to medium term which it is starting to become. It helps that all of this positivity is coming in the wake of a post 2013 U shaped charting pattern, something which is usually the precursor of sustained bull runs.
But before we get too carried away with how solid the technical position here appears to be it may be best to at least develop a road map as to what may happen here over the next 1-2 months. The vehicle for the rise since the autumn has been a rising trend channel from March, one which has its floor based at the 50 day moving average now at 19p. This notional double support zone is the suggested weekly stop loss on the buy argument currently. The chances now are that while there is no weekly close below 19p the upside for Optibiotix as soon as the end of February could be towards the March resistance line at 32p. Once that is reached we may quickly find out how long this improvement may really continue.